Thursday, April 23, 2015

Lab 13 - April 23, 2015 - Magnetic Potential Energy Lab

Lab 13:
April 23, 2015
Brandon Elder

Magnetic Potential Energy Lab

Purpose:
The purpose of this lab is to verify that the conservation of energy applies to this system of an air track glider and to determine an equation to represent the magnetic potential energy in the system, since this is not easily definable.

Background Info and Set-Up:

Assemble the apparatus as shown in Fig. 1. The apparatus consists of an air track with air hose and a glider that rests on the rack. The glider has a magnet at the end and also a magnet at the end of one side of the air track. The magnets have the same polar ends pointing toward each other so that they do not attract each other, they will push each other away when they get close. Energy will transfer into these magnets and this will become the magnetic potential energy. This is part of what we will be measuring in this system, along with the kinetic energy, to determine that the energy is conserved. We will be measuring this by placing a glider on an airtrack and turning the air on to force the glider as close to the other magnet as possible. The air will be cut off and then the distance they are away from each other will be measured.

Fig. 1 The apparatus with the air glider on the
track and the magnets at both ends.
Fig. 1a The freebody diagram
shows that the F equals mgsin(theta).
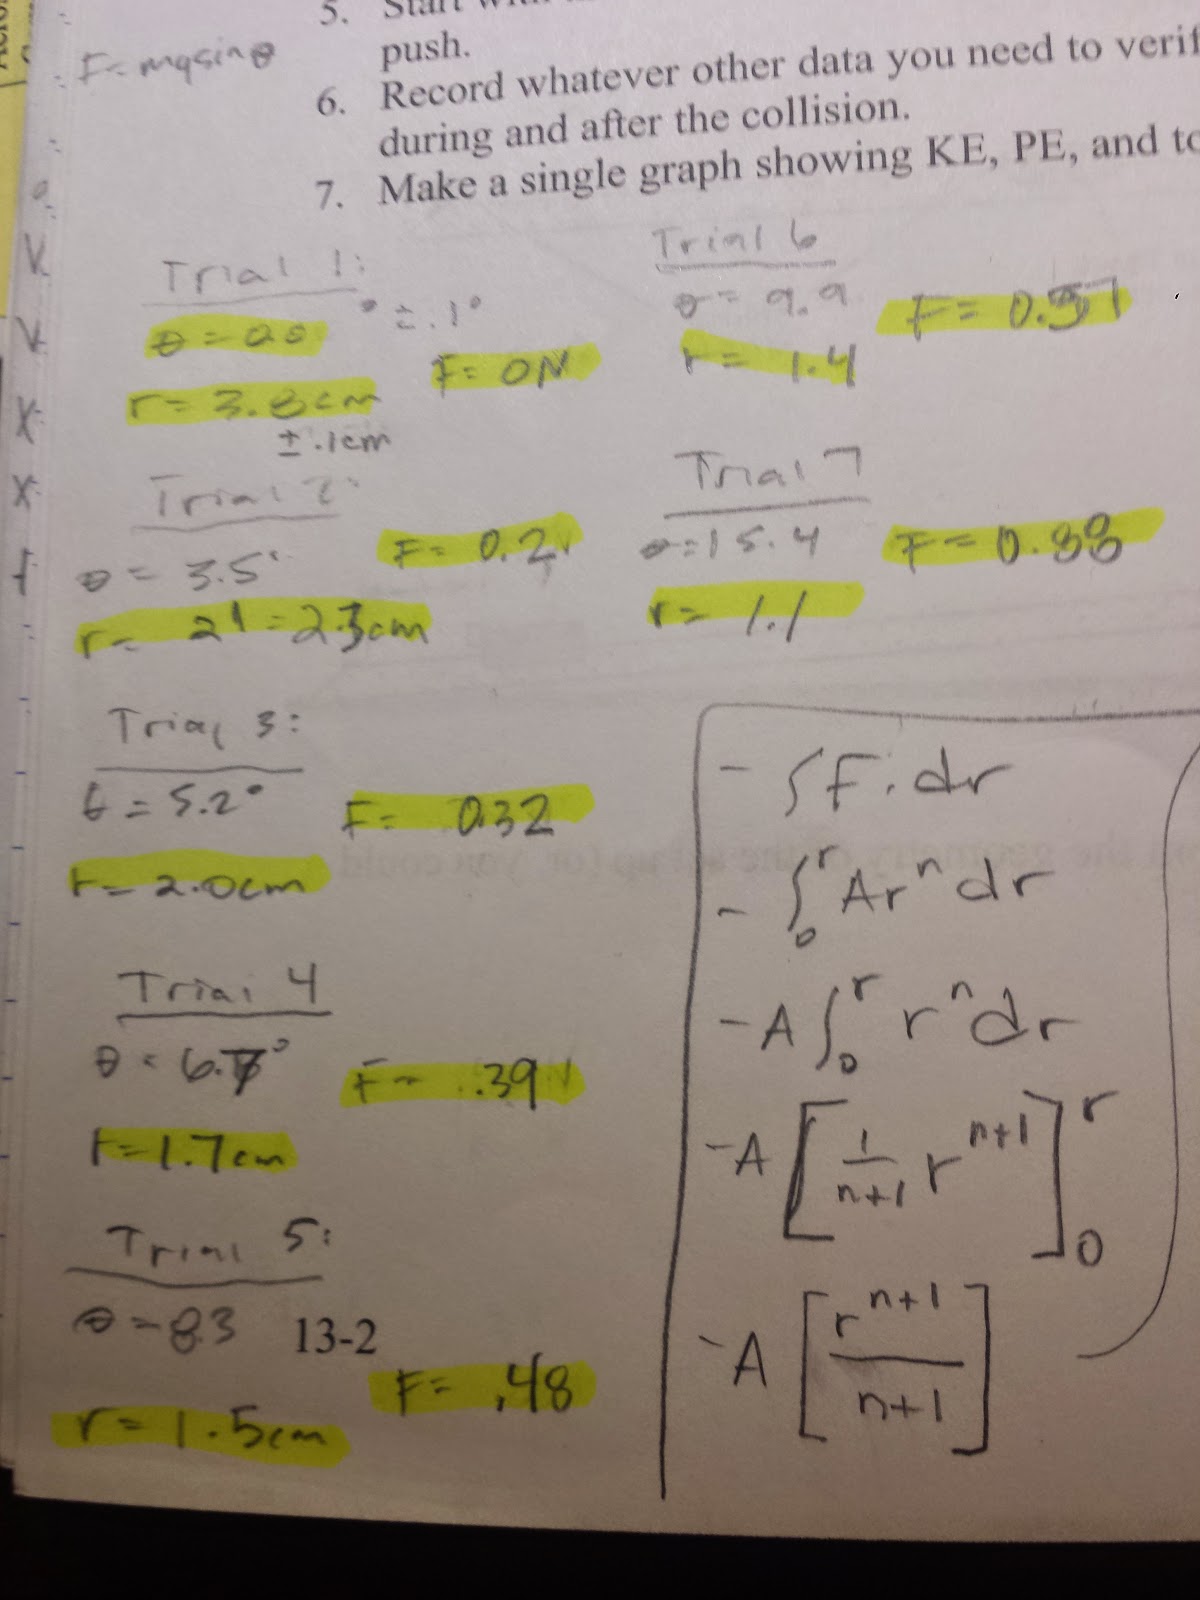
Fig. 1b The data used for theta and r
to plug into Logger Pro.
The first step is to level the track. Next, tilt the track at various angles to measure the distance that the two magnets are away from each other, the separation distance r. This data will be recorded along with the magnetic force F. The separation distance and the force will be plotted and then a best fit line will be applied to determine the relationship and the slope. We can safely assume that this will be a power function therefore giving us some sort of power equation F=Ar^n. A and n will be taken from the best fit graph (see Fig. 2). F can be determined by drawing a free body diagram (see Fig. 1a). The velocity will be fixed as the cart approaches the magnet on the end of the track and it will eventually stop moving as it gets as close to possible to the magnet that the current angle will allow for. The kinetic energy of the cart is then converted into the magnetic field between the two magnets and is the magnetic potential energy. As the car is pushed back away from the magnets it is converted back into the potential energy in the air gliders. To the side is the data (see Fig. 1b) that was used and plugged into LoggerPro to calculate the graph from Fig. 2

Fig. 2 The best fit line of the graph of the separation distance and the Force. This line gives us the values for A and n.

Now we have an equation for the force between the magnets as a function of their separation, F(r). Integrating this will give us an equation for the magnetic potential energy, which we will write as U(r) (see Fig. 3).

Fig. 3 The integral of F(r) gives us an expression
for the magnetic potential energy U(r).


Fig. 4 The graph showing that the energy is conserved. The top line is the graph of the total energies, the kinetic plus the magnetic. The second line under the peak of the total energy line represents the magnetic potential energy. The bottom line is the that represents the kinetic energy in the glider. It makes sense that at the point where the glider can no longer get any closer to the other magnet, the kinetic energy is transferred into the magnetic potential energy and this is where the middle of the graphs are, the spike and drop.

Uncertainties:
There were many sources of error in our data and alot of this is evident in the graph. Many uncertainties were present, in the measurements (+/- .1 cm), in Logger Pro when it gave us the best fit graph of F(r), the device used to measure theta was accurate to +/- 0.1 degrees. 

Conclusion:
We wanted to show that the conservation of energy is true for our system. We had to determine a function that we could integrate to get the magnetic potential energy as a function of how close the magnets got to each other. With that function, U(r), we can then verify that our original purpose was true, which was that the energy is conserved. According to our final graph, this lab shows us that we are correct (see Fig. 4). 


Monday, April 20, 2015

Lab 14 - April 20, 2015 - Physics 4A Impulse-Momentum Activity

Lab 14:
April 20, 2015
Brandon Elder

Physics 4A Impulse-Momentum Activity

Purpose: To show that the impulse can be calculated as the area under the force vs. time graph and that the impulse applied to an object equals the change in momentum of that object.

Definitions:
Impulse combines the applied force and the time interval over which that force acts. The impulse: J is J=F(change in t). On a graph plotted for F and t this would look like the area under the graph. Therefore the impulse is the area under this graph. The area under the graph will equal the the impulse for a constant applied force and for a varying applied force.

Impulse applied to an object equals the change in momentum of that object, in one dimension,
J = change in p (momentum) = Integral of F * dt.

Set-Up: Arrange equipment and apparatus to reflect the image shown in Fig. 1. Perform all calibrations and zeros accordingly for the motion detector and the force sensor, as per all previous labs. It is important to note that during the set up you want to ensure that the stopper of the moving cart hits the plunger of the stationary cart when the moving cart gets close to the end of the track.

Fig. 1 Set up of apparatus. Cart, with a shield attached to let the motion detector know where it is, a force sensor mounted sideways on top of the cart, a mounted cart with a springy bit, and a track for the unmounted cart to roll on. 
Experiment 1: This first experiment will be quick. With logger pro recording data and a graph of force vs time displayed, observe and record. The graph will show that the force is not constant and that the collision is not an elastic collision. Some things to note before recording the official data would be to make sure that the cords are not going to be interfering with any of the readings as this would skew the data. Remember to calibrate the force sensor holding it vertically then to zero the sensor when it is attached horizontally. Practice pushing the cart toward the plunger and watching it bounce to observe the best possible positioning and placement. Zero the force probe and begin graphing. Once you hear the click, give the cart a push towards the mounted plunger, observe as it collides. The resulting graph should look like Fig. 2.

Mass of the Cart with Force Probe: 0.74 kg

Fig. 2 The graph of the first experiment. Here the area under the force vs. time graph is equal to 0.4065
The collision process takes less than half a second as you can see from the graph. The force exerted on the sensor just before and after the collision is zero. The magnitude of the force on the cart is maximum when it is collided the fullest with the spring plunger.

According to the impulse momentum theorem, the Integral of F * dt equals the mass * (velocity final - velocity initial).

Therefore the area under the graph above, 0.4065 should be VERY close if not equal to the difference in our velocities before and after the collision multiplied by the mass.

The velocity difference from before and after the collision multiplied by the mass of the cart is 0.4514. These numbers are very close to each other and this experiment proves that the impulse momentum theory is correct.

Fig a2 The mass of 500 g was added to the cart.
Experiment 2: For this experiment we collected data similar to above but this time we added weight. We added 500 g to the cart (see Fig a2).  The total new weight of the cart was: 1.24 kg. The cart was collided against the spring plunger and the graph was collected, (see Fig. 2 below). We ran two trials and both times the numbers were almost equal and only a few hundredths of a decimal place off. The second trial resulted in an area under the graph of .7156.


Fig. 2 The area under the graph of force vs. time for the larger mass on the cart was 0.7156. The velocity graph was used to determine the velocity before and after the collision. 

The velocity before collision reading: 0.318 m/s
The velocity after collision reading: -0.265 m/s

The difference of those two values multiplied by the mass of the cart is equal to 0.72292. As you can see, that is a difference of only 0.00732 or about a little more than a 1 percent difference. The experiment again goes to show that the impulse-momentum theorem holds true to a larger weight being placed on the cart. 

Experiment 3: This experiment will now show that the theorem holds true for an inelastic collision. The experiment will remove the spring plunger from the side and replace it with a block of wood that has a chunk of soft clay attached to the wood. There will be a nail placed on the edge of the cart and it will stick into the clay when the cart is released. The experiment was ran and the following data was collected:

Area under the graph: 0.5709 N*s
Velocity before collision: 0.428 m/s
Velocity after: 0 m/s
Mass of cart (with nail added) 1.253 kg

The difference in velocity multiplied by the mass in the cart is 0.536 and the area under the cart is .5709. This time the resulting numbers are off by around 5 to 6 percent. This margin of error has increased since the last experiment. However, the answer is still in the ball park and once again shows us that the theorem is correct.

Fig. 2 The area under the graph of force vs. time for the larger mass on the cart was .5709. The velocity graph was used to determine the velocity before and after the collision. 
Conclusion:

The numbers were not exact, but within 1 percent during one of the experiments so that is close. The object of the experiment was to show that the impulse-momentum theorem (as stated earlier) is true. We ran tests of a cart

Tuesday, April 14, 2015

Lab 12: Conservation of Energy - Mass-Spring System

Lab 12:
April 14, 2015
Brandon Elder

Conservation of Energy - Mass-Spring System

Purpose: 
To observe the energy in a system, to show that the energy is conserved by determining all the different places that energy is used in the system and to sum those energies. The kinetic and potential energy of the mass, the kinetic, potential, and elastic energy of the spring, and the gravitational potential energy of the spring will be totaled.

Set-Up and Procedure:
Mount a table clamp with a vertical rod to the table, then mount a horizontal rod to the vertical rod. From that horizontal rod a spring will be attached with a mass hanging from the end of it. A force sensor will be required at first along with the motion detector, so Logger Pro will also be needed to be setup. Reference Fig. 1 for proper set up of the experiment. The spring's natural length will be measured and then the stretch position will be measured in order to determine the constant of the spring. Once the lab is set up, the actual experiment is very short. We will be measuring the distance that the spring oscillates back and forth and the velocity at which this takes place. This will help us determine the kinetic energy.

Fig. 1 The spring here is being stretched
(with mass) above the motion detector while 
connected to the force sensor.
Stretch: Record the position reading when the spring is un-stretched. This value will be used to calculate a column for the "stretch". The unstretched position minus the stretched position will determine the stretched length. Our experiment's data was: 0.618 m (unstretched).

Determine "k":  The slope of the Force vs postion graph will be the k value. The mass is pulled down slowly to stretch the spring. Logger Pro will record the force that is applied in stretching the spring. This data gives us the necessary info to determine the k value from the graph. This will be important later for when we set up the calculated columns. Our "k" value was: 29.32 (see Fig 1a).

Fig 1a Our chart of Force vs. Position. The slope of the best fit line gave us our K value for the spring.


Measure the mass of the spring and the mass of the hanging weight as well as the hanger that is used to hang the mass on. Record these values for insertion into Logger Pro later.

Determine calculated columns for Logger Pro:

Stretch: Use the information above to caluclate the column for stretch.

Elastic Potential Energy in the Spring: 1/2 * "k" * (stretch)^2. K is a value that will be inputted based on the calculations above. Stretch is a column that will be referenced from above.

Gravitational Potential Energy of the Mass: mass (hanging) * gravity * Position. Position will be the column measured in Logger Pro for position.

Kinetic Energy of the Mass: 1/2 * Mass (hanging) * velocity^2. The velocity will be a column that is automatically calculated by Logger Pro during the experiment.

Kinetic Energy of the Spring: In order to determine this it is a three step process. First, choose a representative piece (dm) of spring and write an expression in terms of dy. dm/M = dy/L. Therefore, dm = M/L * dy. Next, write an expression for the KE of that little piece. (1/2)(M/L *dy)(y/L*V(end))^2. This is equivalent to the equation 1/2*m*v^2. The third step requires you to sum the KE's of all the DM's in the spring. This formula will reduce to (1/2)(M(spring)/3)V(end)^2. This is the formula that will be input into Logger Pro.

Gravitational Potential Energy for the Spring: The same steps as above will be followed to derive the formula for GPE spring. The formula that will be input is: Mass (spring)/2 * gravity * y (end of spring). The y value will be the position column from the experiment recorded in Logger Pro. The formula is derived in Fig. 2. 


Sum of All Energy: This column will be a sum of all the columns created above. This will be the column that we use on the graph to show that the energy is conserved in this system.


Fig. 2 The formula derived for the Gravitational Potential Energy of the Spring.

Now that all columns are calculated and prepared for data collection run the experiment. Pull the spring down with the mass on the hanger about 10 cm and let go. Set up a graph to show all of the columns from above on it. They will all be a bit wavy (see Fig. 3).


Fig. 3 All the columns added are shown on the graph here. The top graph (purple) is the sum of all the energy. This graph should be a straight line as we were trying to show that energy is conserved and this is the result of all our energy columns being summed up.

Conclusion:
According to the graph above the GPE of the mass was at it's lowest when the Elastic PE of the spring was at it's highest. Also, when the GPE of the mass was at it's highest, the Elastic PE of the spring was at it's lowest. This makes sense because when the string is fully stretched the mass would have very little gravitational potential energy. As is evident by the above graph, the energy is conserved, even though the individual readings have giant peaks and valleys, the overall sum is relatively staying steady. No amount of energy left the system, and no amount of energy entered the system. All energy was accounted for. Some slight error could have been introduced through errors in the accuracy of the readings of the spring constant measurement. The height may not have been perfectly calibrated with the motion sensor and the spring itself isn't perfectly out of the box in brand new ideal conditions. 


Thursday, April 9, 2015

Lab 11 - April 8, 2015 - Work-Kinetic Energy Theorem Activity

Lab 11:
Brandon Elder
April 8, 2015

Work- Kinetic Energy Theorem Activity

Purpose:
This experiment is three-part, but the main purpose is to be able to measure the work done by a spring on a system by stretching a spring through a measured distance and then graphing the data to determine the relationship between work done and the kinetic energy. In theory, the work done on the spring should equal the amount of kinetic energy of the cart. Analyzing the graph and the area under the curve will give the amount of work done.

Apparatus Set-Up:
Fig. 1 The apparatus set up with the cart connected to the force sensor and the motion
detector placed on the ramp at the far end to observe the cart.
Set up a ramp on the counter top with a force probe, motion detector, and spring. A cart will be placed on top of the ramp and connected to the force probe with the spring. The motion detector will be placed at the opposite end of the ramp (see Fig. 1). Connect the force probe and motion detector to Logger Pro as usual. Some things to note would be that the spring needs to be horizontal when in it's relaxed state in between the cart and the force sensor with no obstruction. If the spring is not horizontal, then some of the force measured when the cart is pulled will be given in the y-direction and will not result in an accurate reading. The file to open in LoggerPro is the L11E2-2 (Stretching Spring), as this will display the force vs. position axes. Finally, the last important things to accomplish during the set-up would be to ensure that the force probe and motion detector are zeroed properly with the spring in the loose state and not stretched. Verify the motion detector is set to "reverse direction" so that as the cart is moved toward the detector, the position info will be recorded in the positive direction. You are ready to perform the experiments.

Considerations: 
Fig. A Graphs of constant vs non-constant forces
being applied to the cart on a horizontal surface.
A constant force applied will result in a linear graph of F vs. x (position or stretch of the spring) while a non-constant force applied will result in a non linear graph (see Fig. A). Work is equal to the force multipled by the displacement which is normally multiplied by cosine of the angle between. However, since we are using a flat surface, the factor of cosine multiplied by 180 results in 1, thereby leaving us with the work being equal to the force times the displacement.


      Fig. 2 Equation for Kinetic Energy.      
Experiment # 1 & 2:
Collect data in logger pro while someone pulls the cart slowly towards the detector until the spring has been stretched approximately 1 meter. The data will then be ready for viewing on the graph and table in logger pro. From observing the table, it is evident that the velocity, position, force, and time have all been calculated.  The next step is to add a calculated column that will define the kinetic energy. Kinetic energy is equal to k=.5*m*(v^2) (see Fig. 2). Since Logger pro automatically calculates the velocity, we create a calculated column for KE, using the formula for KE and inputting the meausred mass of the system, so that we can graph the KE vs position. We then added the KE to the y-axis of the graph so that force and KE were plotted on the y-axis were plotted against the position on the x-axis at the same time. The graph of the force needs to be integrated so that we can compare that value to the value of the KE graph at any point along the graphs. These values should be equal because the KE is equal to the area under the force graph (amount of work done). Fig 2a and 2b show different data points and the values for both the KE and the integrated values or amount of work.

Fig. 2a The integral under the force graph is equal to 0.3493 m*N and the KE at the corresponding point on the KE graph is equal to 0.354 J.


Fig. 2b The integral under the force graph is equal to 0.3241 m*N and the KE at the corresponding point on the KE graph is equal to 0.331 J.

Experiment #3:
A video was shown in class that plotted the Force vs the stretch of a rubber band. We hand sketched a graph similar to the video graph (See Fig. 3). In the last few seconds of the video we are given the time, the change in position, and the mass of the system. The purpose here is to analyze the area under the graph to determine the work done. Then to compare this to the kinetic energy of the cart from the video using the formula for KE to show that the KE is equal (or very close) to the amount of work done on the cart. The calculated KE is shown in Fig 4. The amount calculates out to 23.88 Joules while the area under the graph equals 25.675 Joules. The area under the graph was an estimation from quickly observing the video but it is evident here that the theorem for work and kinetic energy holds true.

Fig. 3 The amount of work done in the system is the area under the graph of work vs stretch. The total work is equal to 25.675 Joules.
Fig. 4 The calculated KE here is equal to 23.88 Joules. This amount was calculated using the variables given to us from the video. This amount of KE is compared to the amount of work from above, under the graph, and it is evident that work is in fact equal to the amount of kinetic energy.

Conclusion:
The spring constant was established by analyzing the force applied to the spring and by evaluating that with the change in position of the spring. The formulas are in Fig. 5. The integral was taken of the graph to find the work done in stretching the spring. In experiment 2 we saw that the work done on the cart by the spring equaled its change in kinetic energy. The experiments proved the work-energy principle that relates work to kinetic energy change by stating that the work done by the net force on a system equals the change in kinetic energy. 


Fig. 5 The formulas used to calculate the spring constant.


Tuesday, April 7, 2015

Lab 9 - April 7, 2015 - Centripetal Force with a Motor

Lab 9:
Brandon Elder
        Pic. 1 The apparatus set up in class by the instructor.     
4/7/2015

Centripetal Force with a Motor

Purpose: 
The purpose of this lab is to observe an apparatus swing a weight around the central shaft at a known radius and to create a model that properly relates theta and omega. We will be comparing the data we record from the experiment and comparing it to the values that we measure for omega and see how they compare.

Set-Up: 
The set-up for this experiment was put together by the instructor in the class (see Fig. 1) for us to observe and record data as he performed the six different experiments. The apparatus was spun around at six different speeds. The time for the weight hanging from the string to swing around for ten revolutions was recorded each time. See Fig. 2 for all the important elements that need to be measured in order to compute for theta. 


Fig. 2 The elements H, R, h, can all be measured by the
apparatus. The x, y, and theta will be calculated after the
experiments.


Measurements: 
The H was measured to be 2 meters. The R was the distance from the center shaft to the string, this distance was measured to be 98 cm or 0.98m. It is important that this distance is not confused with the radius later on during the calculations. The lower case h varied between all the different experiments, so there was six different recordings. The time is also important to record. At each speed we recorded the amount of time it took to make 10 revolutions. This time was then divided by ten to determine the amount of time for one revolution. From the picture you can tell that the hand-drawn in x and y can be calculated with trig. Once all those elements are measured and calculated, the theta can be calculated. It is important not to lose track at this point of the purpose. We needed to determine a relationship between the angular speed and the angle theta. The model that can be derived for theta is in terms of theta, gravity, and the radius. This model was determined from the free-body diagram drawn of the mass hanging from the string (see Fig. 3). The sum of forces equations were also written down after observing the free body diagrams. The sum of forces in the y direction gave us a formula for mass. This can be seen in the top right corner of Fig. 3. This was plugged into the equation for the x direction and then rearranged to give us our final model for omega, the angular speed of our model. This model is seen in Fig. 4. It is again important to note here
that the r in this model is not the same as the R from earlier. The r in this model represents the radius from the central shaft to the mass being rotated. This r would be the sum of the R and the x that were measured earlier. 
Fig. 3 Free body diagrams for the hanging mass. The
sum of forces equations are also written here.

Fig. 4 The model for omega in terms of theta. 

Calculations: 
The calculations for all the above elements were performed during class and recorded onto a sheet of paper (see Fig. 5). The equation from above is re-written down at the top of the picture. For each experiment, the time was recorded first. Then the h value was recorded. The h value was the height off the ground that the weight was for each experiment. This was then plugged into the triangle above it to help solve for the y value. The value of y is measured by taking h and subtracting it from the overall height, H, of 2 meters (200 cm) from earlier. This value was then plugged into the quadratic formula to determine the third side of the triangle, since we measured the length of the string in the beginning. The square root of the length of string squared minus the y value squared was the x value. Theta was then found by taking the inverse sine function of the x value over the length of string value. Finally, at the far right is the omega values. That would be our calculated values of omega based on the angle theta that we calculated from the experiment. The theta value that was just determined was plugged into our model from Fig. 4 and we wrote down our data for omega values.

Fig. 5 All recorded calculations for all the elements discussed above. Take note of the highlighted figures for the first
experiment. The same logic was followed for the next 5 experiments, I just highlighted the first one to help with clarity.
Fig. 6 The values of the measured omega using the time we      
measured in class for one revolution and the values that
were calculated for omega from the experimental data used
to determine theta. 
Finally, we must measure what the actual omega value from the experiment was. This is done by taking the formula highlighted in the top left of the picture in Fig. 5. The measured value was derived by dividing 2*pi and T (time in seconds for one revolution). The experimental values of omega are all listed under the calculated values for omega in the right side of the picture. A comparison chart of these values is shown in Fig. 6. The numbers for the experiments were cut off in the picture, but they are listed in chronological order, all six experiments.


Comparison:
Now that all six values of theta and omega have been calculated, we can compare these values to each other and determine how close our data was experimentally vs calculated. It appears that the data is very close, but one way of determining how close to accurate these values are, would be to graph the data points and then to apply a best fit line to the data. The slope of the graph of the data points should be very close to one. This would tell the user that the data sets were equal to each other and that the experiment was a valid way of determining the angular speed of a system. If you take a look at Fig. 7, you will determine that our calculations/measurements have quite a high degree of error in them, as the result (slope of the line) should have been much closer to one.

Fig. 7 The slope of the best fit line was 0.78, this is not as close to 1.0 as we were hoping for. This means that there was error in our measurements.
Uncertainties in Lab, Assumptions We Made, and What Was Ignored:

It is evident that some uncertainty in this lab became apparent when reviewing the graph and noticing how far off the slope of the best fit line was from 1.0. This was most likely due to some error in the recording of the data. Two of our data points appeared to be off much more than the other points. I used the strike-through data cells in Logger Pro to remove these two points from the best fit line and noticed that the slope of the line became much more closer to 1.0 (see Fig. 8).

Fig. 8 With two of the points being taken out of the factoring of the best fit line, the slope moves much more closer to 1.0.
Other uncertainties came from the measurements in our data. The time had an uncertainty of plus or minus .01 second and the height measurements had an uncertainty of plus or minus .5 cm. These amounts of uncertainty would have caused the data to have some error introduced into our measurements and calculations. The exact moment at which the weight traveled around for 10 revolutions would have varied between each experiment as the recording was subjective based on the person hitting the start and stop button on the watch.

Overall, we learned that we can derive an equation for angular speed from observing a system in class that allows us to measure the speed of an object throughout several revolutions. This equation was then compared to our known equation of 2pi/time. The end result was that our model was an accurate method to determine angular speed and did NOT depend upon mass, but only on the radius, gravity, and the angle.